LineChart in SwiftUI
Result
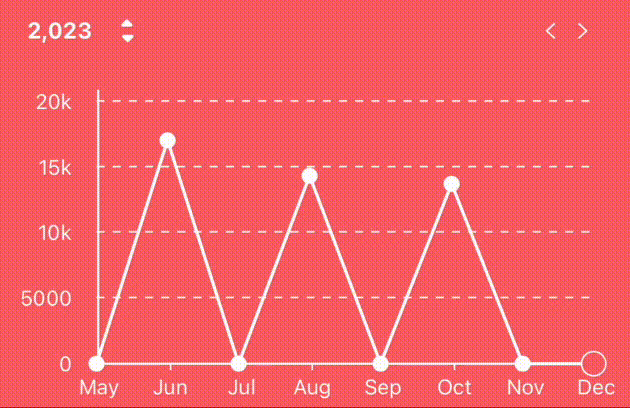
Design
Features
- x/y axis
- X axis means month in this case. It always shows 8 monthes, which can control its width better.
- Y axis displays data based on month. It has a wide range from 1 to 100k. Using abbreviation to control its width better.
- next/previous year/month button
- dotted line
- dot on the data
Data
- chartData: A dictionary. Key is year, value is data of this year.
- displayData: A list of Double value. data[0] represent data in Jan, data[1] represent data in Feb…
- endMonth: Int value. The display month will from 0 to endMonth or endMonth-8 to endMonth
Implement
Chart Line
1
2
3
4
5
6
7
8
9
10
11
12
13
14
15
16
17
18
19
20
// yValues is the list of the data
// factor is the scale factor based on the chart height and max data
struct LineChartShape: Shape {
    var yValues: [Double]
    var factor: Double

    func path(in rect: CGRect) -> Path {
        let xIncrement = (rect.width / (CGFloat(yValues.count - 1)))
        var xValue = 0.0
        var path = Path()
        path.move(to: CGPoint(x: xValue, y: (rect.height - (yValues[0] * factor))))
        for i in 1..<yValues.count {
            xValue += xIncrement
            let pt = CGPoint(x: xValue,
                             y: (rect.height - (yValues[i] * factor)))
            path.addLine(to: pt)
        }
        return path
    }
}
X Axis
1
2
3
4
5
6
7
8
9
10
11
12
13
14
15
16
17
18
19
20
21
22
23
24
25
26
27
28
29
30
31
32
33
34
35
36
37
38
39
40
41
42
struct XaxisView: View {
    var data: [Double]
    let month = ["Jan", "Feb", "Mar", "Apr", "May", "Jun", "Jul", "Aug", "Sep", "Oct", "Nov", "Dec"]
    var endMonth: Int

    var body: some View {
        GeometryReader { gr in
            let labelWidth = (gr.size.width * 0.9) / CGFloat(data.count - 1)
            let padWidth = (gr.size.width * 0.05) / CGFloat(data.count - 1)
            let labelHeight = gr.size.height
            let tickHeight = gr.size.height * 0.2
            let offset = endMonth - 8
            ZStack {
                Rectangle()
                    .frame(width:gr.size.width, height: 1.5)
                    .offset(x: 0, y: -(gr.size.height/2.0))
                    .foregroundColor(.white)

                HStack(spacing:0) {
                    ForEach(0..<data.count, id: \.self) { i in
                        ZStack {
                            VStack {
                                Rectangle()
                                    .frame(width: 1, height: tickHeight)
                                    .foregroundColor(.white)
                                Spacer()
                            }
                            Text(month[i + offset])
                                .font(.footnote)
                                .scaledToFill()
                                .frame(width:labelWidth, height: labelHeight)
                                .offset(CGSize(width: 0.0, height: 5.0))
                                .foregroundColor(.white)
                        }
                    }
                    .padding(.horizontal, padWidth)
                }
            }
            .offset(CGSize(width: -(gr.size.width / CGFloat(data.count))/2.0 - 1, height: 0.0))
        }
    }
}
Y Axis
1
2
3
4
5
6
7
8
9
10
11
12
13
14
15
16
17
18
19
20
21
22
23
24
25
26
27
28
29
30
31
32
// calculate axis parameters with given steps
struct AxisParameters {
    static func getTicks(top:Double) -> [Int] {
        let steps = [5, 10, 15, 20, 25, 30, 50, 100, 150, 200, 250, 300, 500, 1000, 1500, 2000, 2500, 3000, 5000, 10000, 15000, 20000, 25000, 30000, 50000, 100000]
        var step = 1
        var dis = 100000
        for v in steps {
            if abs(v - Int(top / 3.0)) < dis {
                step = v
            }
            dis = abs(v - Int(top / 3.0))
        }
        var high = Int(top)

        high = ((Int(top)/step) * step) + step + step
        var ticks:[Int] = []
        for i in stride(from: 0, to: high, by: step) {
            ticks.append(i)
        }
        return ticks
    }

    static func getStringTick(tick: Int) -> String {
        var stringTick: String
        if tick < 10000 {
            stringTick = "\(tick)"
        } else {
            stringTick = "\(Int(tick/1000))k"
        }
        return stringTick
    }
}
1
2
3
4
5
6
7
8
9
10
11
12
13
14
15
16
17
18
19
20
21
22
23
24
25
26
27
28
29
30
31
32
33
// ticks: axis parameters
// scaleFactor: control the position based on the chart height and max data
struct YaxisView: View {
    var ticks: [Int]
    var scaleFactor: Double

    var body: some View {
        GeometryReader { gr in
            let fullChartHeight = gr.size.height
            ZStack {
                // y-axis line
                Rectangle()
                    .foregroundColor(.white)
                    .frame(width:1.5)
                    .offset(x: gr.size.width/2.0 + 1, y: 1)

                // Tick marks
                ForEach(ticks, id:\.self) { t in
                    HStack {
                        Spacer()
                        Text("\(AxisParameters.getStringTick(tick: t))")
                            .font(.footnote)
                            .scaledToFill()
                            .minimumScaleFactor(0.01)
                            .lineLimit(1)
                            .foregroundColor(.white)
                    }
                    .offset(x: -15, y: (fullChartHeight/2.0) - (CGFloat(t) * CGFloat(scaleFactor)))
                }
            }
        }
    }
}
Dotted Line & Data Point
1
2
3
4
5
6
7
8
9
10
11
12
13
14
15
16
17
18
19
20
21
22
23
24
25
26
27
// dotted line should be used with .stroke
// shown in the next block
struct Line: Shape {
    func path(in rect: CGRect) -> Path {
        var path = Path()
        path.move(to: CGPoint(x: 0, y: 0))
        path.addLine(to: CGPoint(x: rect.width, y: 0))
        return path
    }
}
struct MarkerShapeWhite: Shape {
    var yValues: [Double]
    var factor: Double
    var radius: Double

    func path(in rect: CGRect) -> Path {
        let xIncrement = (rect.width / (CGFloat(yValues.count - 1)))
        var xValue = 0.0
        var path = Path()
        path.addEllipse(in: CGRect(x: xValue - radius, y: (rect.height - radius - (yValues[0] * factor)), width: radius * 2.0, height: radius * 2.0))
        for i in 1..<yValues.count-1 {
            xValue += xIncrement
            path.addEllipse(in: CGRect(x: xValue - radius, y: (rect.height - radius - (yValues[i] * factor)), width: radius * 2.0, height: radius * 2.0))
        }
        return path
    }
}
Chart Area
1
2
3
4
5
6
7
8
9
10
11
12
13
14
15
16
17
18
19
20
21
22
23
24
25
26
27
28
29
30
31
32
33
34
35
36
37
38
// Chart Area creates the view inside the graph, including the chart, dotted line, data point, but not including x/y axis
struct ChartAreaView: View {
    var data: [Double]
    var ticks: [Int]
    var scaleFactor: Double

    var body: some View {
        GeometryReader { gr in
            ZStack {
                ForEach(ticks, id:\.self) { t in
                    if t > 0 {
                        Line()
                           .stroke(style: StrokeStyle(lineWidth: 1, dash: [5]))
                           .frame(width: gr.size.width ,height: 1)
                           .foregroundColor(.white)
                           .offset(y: (gr.size.height/2.0) - (CGFloat(t) * CGFloat(scaleFactor)))
                    }
                }


                LineChartShape(yValues: data, factor: scaleFactor)
                    .stroke(lineWidth: 2.0)
                    .foregroundColor(.white)

                MarkerShapeWhite(yValues: data, factor: scaleFactor, radius: 5)
                    .foregroundColor(.white)

                // the last point
                // create it outside the MarkerShapeWhite to make it in different color
                // for convenient, using the image rather than view
                Image("point")
                    .position(CGPoint(x: gr.size.width/2 + 8, y: gr.size.height/2 + 8))
                    .offset(x: 0, y: -data.last! * scaleFactor)
                    .frame(width: 16, height: 16)
            }
        }
    }
}
Line Chart
1
2
3
4
5
6
7
8
9
10
11
12
13
14
15
16
17
18
19
20
21
22
23
24
25
26
27
28
29
30
31
32
33
34
35
36
37
38
39
40
41
// this struct create the final line chart with given data and endMonth
struct LineChartView: View {
    var data: [Double]
    var endMonth: Int

    @State private var offset = CGSize.zero

    var body: some View {

        GeometryReader { gr in
            let maxValue = data.max() ?? 0
            let axisWidth = gr.size.width * 0.12
            let axisHeight = gr.size.height * 0.1
            let fullChartHeight = gr.size.height - axisHeight

            let tickMarks: [Int] = AxisParameters.getTicks(top: maxValue)
            let scaleFactor = (fullChartHeight * 0.95) / CGFloat(tickMarks[tickMarks.count-1])

            VStack(spacing:0) {

                HStack(spacing:0) {
                    YaxisView(ticks: tickMarks, scaleFactor: Double(scaleFactor))
                        .frame(width:axisWidth, height: fullChartHeight)
                    ChartAreaView(data: data, ticks: tickMarks, scaleFactor: Double(scaleFactor))
                        .frame(height: fullChartHeight)
                    Spacer()
                }
                .zIndex(1)

                HStack(spacing:0) {
                    Rectangle()
                        .fill(Color.clear)
                        .frame(width:axisWidth, height:axisHeight)
                    XaxisView(data: data, endMonth: endMonth)
                        .frame(height:axisHeight)
                    Spacer()
                }
            }
        }
    }
}
Apply LineChart in the View
1
2
3
4
5
6
7
8
9
10
11
12
13
14
struct MyChartView: View {
    @Binding var MyData: [Double]
    @Binding var endMonth: Int

    var body: some View {

        GeometryReader {
            gr in
            LineChartView(data: self.MyData, endMonth: self.endMonth)
            .frame(width: gr.size.width, height: gr.size.height)
        }

    }
}
Apply MyChartView in the View
1
2
3
4
5
6
7
8
9
10
11
12
13
14
15
16
17
18
19
20
21
22
23
24
25
26
27
28
29
30
31
32
33
34
35
36
37
38
39
40
41
42
43
44
45
46
47
48
49
50
51
52
53
54
55
56
57
58
59
60
61
62
63
64
65
66
67
68
69
70
71
72
73
74
75
76
77
78
79
80
81
82
83
84
85
86
87
88
89
// part of code inside the body
// contains the year and its control button
// yearMax is a state value of the current year
// yearMin is a state value decided by the data
// generateDisplayData is a function generate a list based on the year, endMonth and ChartData (Dictionary of year and list of data)
VStack {
    HStack (spacing: 10) {
        Text("\(year)")
            .font(.system(size: 14, weight: .bold, design: .default))
            .padding(.leading, 18)
            .foregroundColor(.white)
            .onChange(of: year) {
                newValue in
                generateDisplayData(year: year, endMonth: endMonth)
            }

        VStack (spacing: 5) {
            Button(action: {
                if self.year < self.yearMax {
                    self.year += 1
                    self.endMonth = self.chartData[year]!.count
                }
            }, label: {
                Image("arrow_up")
                    .resizable()
                    .frame(width: 24, height: 24)
            })

            Button(action: {
                if self.year > self.yearMin {
                    self.year -= 1
                    self.endMonth = self.chartData[year]!.count
                }
            }, label: {
                Image("arrow_down")
                    .resizable()
                    .frame(width: 24, height: 24)
            })
        }
        .onChange(of: endMonth) {
            newValue in
            generateDisplayData(year: year, endMonth: endMonth)
        }

        Spacer()

        Button(action: {
            if self.endMonth > 8 {
                self.endMonth -= 1
            } else if endMonth == 8 && year > self.yearMin {
                self.endMonth = 12
                self.year -= 1
            }
        }, label: {
            Image(systemName: "chevron.left")
                .resizable()
                .scaledToFit()
                .frame(width: 10, height: 10)
                .foregroundColor(.white)
        })

        Button(action: {
            if self.endMonth < 12 && self.chartData[self.year]!.count > endMonth {
                self.endMonth += 1
            } else if endMonth == 12 && year < self.yearMax {
                self.endMonth = 8
                self.year += 1
            }
        }, label: {
            Image(systemName: "chevron.right")
                .resizable()
                .scaledToFit()
                .frame(width: 10, height: 10)
                .foregroundColor(.white)
        })


        Spacer()
            .frame(width: 16)
    }

    HStack {
        Spacer()
            .frame(width: 18)
        MyChartView(MyData: $displayData, endMonth: $endMonth)
            .frame(width: UIScreen.main.bounds.size.width * 356 / 390, height: UIScreen.main.bounds.size.height * 188 / 844, alignment: .center)
        Spacer()
    }
}
This post is licensed under CC BY 4.0 by the author.